This is the third in a set of three pieces on carbon pricing and regulation. The first, Carbon Pricing and Regulations Compared: An Economic Explainer, written with Shuting Pomerleau, presents the basics. The second, The Role of Carbon Pricing in Deep Decarbonization, extends the analysis to the case where the objective is to reduce greenhouse gas emissions to net zero, not simply to slow their rate. This article further extends the analysis to discuss analytical, allocational, and behavioral effects of carbon pricing and its interaction with climate regulations.
Deep decarbonization of the U.S. economy, let alone of the entire world, is a daunting task. No single approach to climate policy is going to accomplish the mission by itself.
That said, among the policy alternatives, carbon pricing is perhaps the most widely discussed, but also most widely misunderstood. Whether envisioned in the form of carbon taxes or emissions trading (cap-and-trade), carbon pricing is often portrayed as a one-trick pony that nudges consumers toward burning less gasoline and utilities to switch from coal to gas, but does little else. In reality, though, carbon pricing is capable of doing far more than that. It is highly versatile, touching every corner of the economy, and capable of working hand-in-hand with other tools of climate policy to increase their effectiveness. Figure 1, which is adapted from a paper by Fergus Green and Richard Denniss, provides an overview of the climate policy toolkit. It is based on three distinctions that will be useful in framing the issues discussed in this commentary.
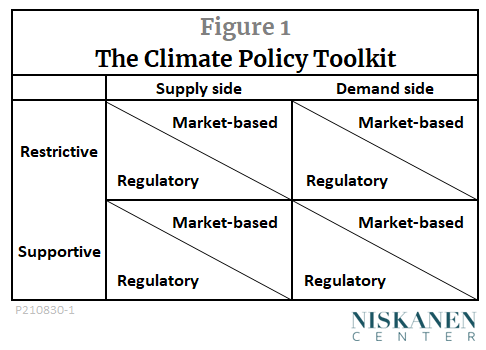
The first distinction is between market-based and regulatory policies. Market-based policies are those that aim to affect behavior by raising or lowering the prices of goods and services whose production or consumption affect the rate of climate change. Carbon taxes and emissions trading are the leading examples, known collectively as carbon pricing. Regulatory policies include a wide variety of command-and-control measures, such as technology mandates and performance standards.
Carbon pricing and regulations, in turn, can be categorized as demand-side or supply-side, according to whether they principally affect the demand for emission-intensive goods and services or their supply. Policies can be further categorized as restrictive or supportive. Restrictive policies use market incentives or regulatory mandates to discourage activities that contribute to climate change while supportive policies encourage green energy, clean infrastructure, and other mitigation measures.
As the following sections will show, the versatility of carbon pricing arises from three distinct modes by which it acts on the economy:
- It induces buyers and sellers to reallocate resources away from carbon (allocative effects). As regards sellers, this point is not widely appreciated.
- It makes some people richer and others poorer (distributional effects). What’s often missed is that combined with other policies, carbon pricing can be an equalizing force, even before revenue is redistributed.
- It incentivizes people to cut back on fossil fuels where it is most economically efficient, giving us more bang for the buck (behavioral effects). But because consumers don’t perfectly price out every decision, regulations are needed to steer some markets.
These three modes of action, either alone or in conjunction with regulatory policies, extend to all of the eight cells of the climate policy toolkit.
Allocative effects, direct and indirect
The fundamental idea behind carbon taxes and emissions trading is that prices affect resource allocation. If you raise the price of something, you discourage buyers; if you lower the price, you discourage sellers. But many climate watchers, including Green and Denniss themselves, wrongly assume that carbon pricing is merely a policy that restricts demand — confining its effects to the upper-right-hand quadrant of the policy toolkit.*
In fact, however, even the simplest analysis shows that a carbon price acts equally on the demand for high-emission products and on their supply. That is clear from Figure 2, which illustrates the effects of carbon pricing with the case of a carbon tax on the global oil market. In this case, the tax is set at $50 per ton of CO2, which we assume would amount to $20 per barrel of oil.
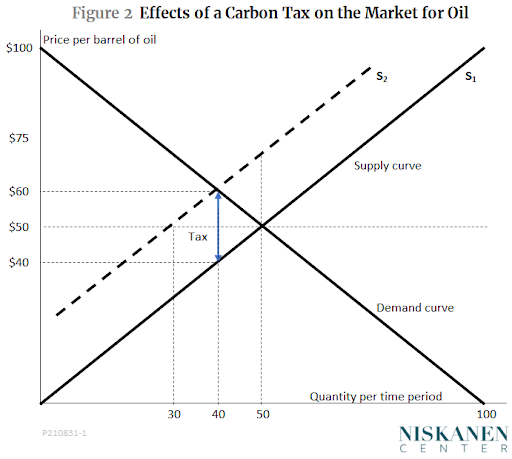
Before the tax, the equilibrium market price is assumed to be $50 per barrel and the equilibrium quantity 50 million barrels per day. Imposing the tax on oil producers raises the cost of production by the assumed $20 per barrel, shown in Figure 2 as an upward shift of the supply curve from S1 to S2. The tax puts pressure on the highest-cost producers to leave the market. Falling output, in turn, puts upward pressure on prices, causing the least eager buyers to drop out. Together, these actions by buyers and sellers of oil move the market up and to the left along the demand curve until a new equilibrium is reached where the supply curve S2 intersects the demand curve. At that point, the price paid by sellers, including the carbon tax, is $60 and the after-tax price received by producers is $40.
Depending on the exact slopes of the supply and demand curves, the tax burden need not be divided exactly equally between producers and consumers. But whatever the division of the tax burden, the price paid by buyers will rise and the price received by the sellers will fall until the difference between the two is equal to the $20-per-barrel carbon tax. In the terminology of the climate policy toolkit, then, the direct allocative effects of the tax include both a restrictive demand-side effect and a restrictive supply-side effect.**
Beyond these direct allocational effects, the indirect effects of a carbon price would quickly spread from oil to other markets.
Any firm that relies on oil to provide a good or service would be affected. A higher oil price would cause an upward shift in the supply curves for air and surface transportation, for plastics that use petroleum feedstocks, for rentals of apartments heated by oil furnaces, and so on. The consequences would be similar to those shown in Figure 1: Producers, who would see their costs increase, would cut back their output, while consumers, seeing increases in the prices they pay, would reduce their purchases.
Markets for goods that are substitutes for or complements of oil would also feel the effects. Other things being equal, an increase in the relative price of oil (or any good) causes an increase in demand for its substitutes. For example, solar electricity is a substitute for gasoline as a power source for passenger cars. In this case, an increase in the price of gasoline caused by a carbon price would create a supportive demand-side effect for its substitute, renewable electricity. The increase in demand for green electric power in turn, would encourage its supply – a supportive supply-side effect.
Finally, an increase in the supply of any good causes a decrease in demand for its complements, that is, for goods that are used together with it. Vehicles powered by internal combustion engines are an example of a complement for petroleum-based fuels. When the price of those fuels goes up, other things being equal, people buy fewer of such cars (restrictive demand-side effects) and more electric vehicles instead (supportive demand-side effects). The shifts in demand, in turn, trigger restrictive and supportive supply-side effects in the markets for internal-combustion and electric vehicles, respectively.
In short, it is wrong to think that the effects of carbon pricing are confined to just one corner of the climate policy toolkit. Quite the contrary, a carbon tax affects resource allocation in four distinct ways: Restrictive effects on both the supply- and demand-side in markets for high-carbon goods and services, and supportive effects on both the supply and demand side in the markets for low-carbon goods. But widespread though they are, the allocative effects of carbon pricing are only part of the story.
Distributional effects of carbon pricing
Let’s turn next to the distributional effects of carbon pricing. Probably the most widely discussed is the potentially disproportionate impact of higher energy prices on low-income households. One response to that concern, favored by the Citizens’ Climate Lobby, among others, is a fee-and-dividend approach that would distribute the entire revenue raised by a carbon tax equally to all citizens. Doing so would be more than enough to compensate low-income households for their higher cost of living. In fact, as discussed in this earlier commentary, it is likely that even after full compensation was made, some revenue would be left over for green infrastructure or other climate-related purposes.
But how to spend the carbon tax revenue is by no means the only important distributional issue in climate policy. Nearly any climate policy, whether market-based or regulatory, would have some kind of distributional effect. Consider, for example, the “keep it in the ground” approach to limiting emissions from fossil fuels.
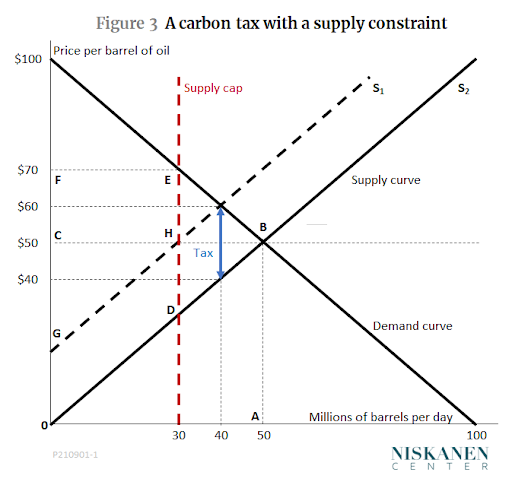
Figure 3, which is a variation of Figure 2, shows how a cap on fossil fuel extraction would affect the distribution of costs and revenues among participants in the oil market. As before, in the absence of any restrictive policies, the market would produce 50 million barrels of oil a day at a price of $50. The vertical red line shows the effects of an output cap designed to limit production to 30 million barrels per day.
The allocational effects would be similar to those of a tax. However, the supply cap would also have distributional consequences, not all of them intended.
A closer look at Figure 3 will show the nature of those distributional effects. Starting from the original policy-neutral situation, production of 50 million barrels of oil a day at a price of at $50 per barrel would generate $2.5 billion a day in revenue for the oil companies, as shown by the rectangle 0ABC. An amount equal to the area 0AB under the supply curve would go to cover the variable costs of production. Those costs are very low for the first barrels produced, which come from the most accessible wells, and gradually increase along the supply cure as more difficult oil fields are tapped. Variable cost accounts for exactly half the revenue in this simple case where the supply curve is a straight line beginning from the origin. The remaining $1.25 billion, equal to the triangle 0BC, would accrue to the oil companies as what economists call producer surplus. Some of the producer surplus goes to cover the companies’ fixed costs, such as salaries, equipment, and financing costs, which cannot be assigned to a specific unit of output or a particular oil field. The rest is profit.
Imposing a supply cap at 30 million barrels per day changes the situation. As the market price rises to $70, oil companies sell only 30 million barrels per day for a lower total revenue of $2.1 billion. The cost of production decreases more quickly, however, since the highest-cost oil fields are the first to be shut down. (The declining marginal cost per unit produced corresponds to a movement downward and to the left along the supply curve.) Now the variable cost of production is a mere $450 million, represented by the area under the supply curve up to 30 million barrels per day. As a result, total producer surplus rises to $1,65 billion per day, equal to the area 0DEF. Since fixed costs are not affected, all of the increase in producer surplus flows through to profits.
Under the circumstances of Figure 3, then, a keep-it-in-the-ground supply cap is a bonanza for the oil companies. That should be no surprise. The cap accomplishes exactly what oil producers attempt when they negotiate cartel agreements to restrict supply and boost profits. However, whereas the real-world OPEC oil cartel is continually undermined by cheating on output quotas, the kind of supply caps advocated by climate activists, such as the proposed Fossil Fuel Nonproliferation Treaty, would have the force of law behind them.
But, although oil producers would be happy with the boost to profits from a cap of 30 million barrels per day, they would be likely to resist the further tightening of the cap that would be required to achieve deep decarbonization. For example, restricting the cap from 30 to 20 million barrels per day would reduce profits by $250 million per day. And, of course, reducing the cap to zero would reduce profits to zero. Realizing that, the producers would very likely spend a part of the bonanza they received from an early, moderate supply cap to put up a political and public relations fight against further tightening.
How could these unintended distributional consequences be avoided? One way would be to impose a carbon tax at the same time as the supply cap. For example, if a tax were imposed at a rate of $50 per ton of CO2 (equivalent to $20 per barrel), the unintended enrichment of producers would be considerably reduced. As was the case in Figure 2, the extra cost of the tax would shift the supply curve upward from S1 to S2. With both the tax and the cap in place, revenue from the tax would be $600 million per day, equal to the area 0DHG. That would reduce producer surplus from the cartel-like $1.65 billion per day to just $1.5 billion. Producers would have that much less to spend on lobbying and public relations, and the revenue from the tax would be available to invest in other climate mitigation or adaptation projects, compensate low-income consumers for increased energy prices, or any other purpose.
In short, a supply cap and a carbon tax would be complementary, but, in this case, in a way that arises from the distributional rather than the allocative effect of the tax. A carbon tax at any rate that shifts the supply curve upward by less than $40 (that is, any tax less than roughly $100 per ton of CO2) would have no important allocative effect. It would change neither the quantity of oil produced, nor its price compared with the effects of a supply cap alone. However, within this range, less of the increase in revenues brought about by higher oil prices would accrue to producers while more would become available for other public purposes in the form of tax revenue.
Behavioral complementarities
For a third example of the ways in which carbon pricing can complement regulatory climate policies, we turn from the allocational and distributional effects that economists traditionally emphasize to the newer field of behavioral economics. As an example, we will look at a type of regulations known collectively as Minimum Energy Performance Standards (MEPS). Examples of MEPS include efficiency standards for home appliances, lightbulbs, and electric motors. MEPS fall into the restrictive, demand-side, and regulatory section of the climate policy toolkit shown in Figure 1, since their main purpose is to reduce energy use and its associated greenhouse gas emissions.
But, if MEPS and carbon pricing both have the objective of restricting the demand for high-emission activities, why would we need both? One reason, as economists have long argued, is that carbon pricing does a better job than regulation alone in prioritizing the adoption of energy-efficient technology where it is most cost-effective. For example, a carbon price that raised the cost of electricity would provide a strong inducement to replace the old, power-hungry refrigerator in your home with a new, high-efficiency model, but a much weaker incentive to do the same for the refrigerator in a vacation home that you only use two weeks a year. The money you don’t spend on a new refrigerator for your summer cabin could go instead for an energy-efficient dishwasher at home. Or consider electric heat pumps, which save more carbon in areas where the electricity to run them is generated mostly by wind and solar than in areas where it comes from coal or gas. With a carbon price in force, electric rates would rise in areas that depended on fossil fuels and stay low where renewable power was abundant – just what would be needed to ensure electric heat pumps were adopted most rapidly in the regions where they did the most to reduce emissions.
By itself, this purely allocative argument suggests that a carbon price alone, without supporting MEPS regulations, would be enough to reduce emissions by any desired amount. However, that depends on how well buyers in the market understand the lifetime benefits of more efficient technologies. An engineer at a large corporation might calculate the exact lifetime savings of switching the company’s showrooms from fluorescent to LED lighting, but for the average consumer, that might seem more trouble than it is worth.
Researchers who apply the findings of behavioral economics to the decisions consumers have discovered that they often apply “bounded rationality.” Consumers take decision-making shortcuts or apply rules of thumb that often lead to suboptimal decisions. That can make them slow to adopt new, more efficient technologies. In such cases, a regulation that makes it impossible to stay with the status quo (for example, impossible to buy a new box of incandescent lightbulbs) might be more effective in reducing emissions than a simple increase in electric rates. At the same time, economists who apply a behavioral perspective recognize that carbon taxes or emission caps can play useful roles as signals of a need for conservation even in cases where consumers cannot be expected to make exact calculations.
A recent special issue of the journal Energy Efficiency was devoted entirely to demand-side policies to limit climate change. Several contributors argued that the best way forward consists of combining the allocative incentives of carbon pricing with the behavioral restrictions inherent in MEPS. As the authors of one of the papers wrote, “Our modeling results suggest that carbon taxes coupled with strong energy-efficiency policies would produce synergistic effects that could meet deep decarbonization goals.”
The bottom line
Economists are used to explaining the effects of carbon pricing with tidy diagrams like Figure 2. Unfortunately, overreliance on such diagrams and on simple formulations like “if you charge more for something, people will use less of it” can backfire. They narrow the focus to allocational effects alone, and sometimes give the impression that economists regard carbon pricing as a silver bullet that can handle the whole task of deep decarbonization by itself. Critics understandably push back against that oversimplified view. One critic has gone so far as to say, “of the policy tools in the carbon toolbox, carbon pricing is the tiny flathead screwdriver used to fix glasses.”
The truth is more complex. Carbon pricing is not a panacea, but neither is it just a tiny flathead screwdriver. Instead, carbon pricing is a policy whose effects extend to every corner of the market economy that we rely on to organize production and consumption. Furthermore, those effects go beyond allocational impacts on supply and demand. The distributional effects of carbon pricing can be enlisted to serve the causes of environmental justice, of building political support for climate action, and of mobilizing financial resources for green investment. Finally, if carbon prices and regulations are properly designed to work together, they can overcome behavioral resistance to the changes needed to bring about deep decarbonization.
Taking all of this into account, it is time, in my opinion, for supporters of all the various types of climate policy – supply-side vs. demand side measures; market-based vs. regulatory approaches; and supportive vs. restrictive mechanisms – to stop squabbling among themselves. In particular, it is time for those who most fervently urge deep decarbonization to stop sniping at carbon pricing as ineffective, politically toxic, or ideologically suspect. Carbon pricing is not ideology; it is just a tool, but a uniquely versatile one without which it will be difficult, if not impossible, to get the job done.
*That assumption is made clear in this line from Green and Denniss (p. 73) “The literature on the comparative evaluation of climate policy instruments has focused overwhelmingly on economic analyses of instruments aimed at restricting demand for greenhouse gas emissions (especially carbon taxes and cap-and-trade schemes) … Evaluation of instruments aimed at restricting the upstream supply of commodities or products whose downstream consumption causes greenhouse gas emissions — such as fossil fuels — has largely been neglected in this literature.”
** Some readers might object that the tax only reduces the rate of oil output and carbon emissions rather than eliminating them altogether. As Figure 2 is drawn, that is true enough. To achieve deep decarbonization, the carbon price would have to rise over time. This previous commentary explains how either a carbon tax or emissions trading could be designed to guarantee eventual zero emissions.