Just another name for a double bottom.
2B Dragon double bottoms are strong reversal patterns. They form in every market and on any time frame chart.

They have all of the characteristics associated with other variously named double bottom patterns, such as the "Ugly", the "Adam & Eve" and "Eve & Eve". What sets the 2B Dragon apart is the near exact bottom prints and the consolidation area that usually forms - somewhere after the second bottom is complete. Naming it and it's component parts is just for fun.
Being that I define a 2B Dragon as a trend reversal pattern, in order to identify and validate it
there has to be a trend to reverse
That is, there must be a "tail" on the upper left hand side of the chart where prices have trended down from, relative to current prices.
The Legs
Next you should see two distinct areas where prices refused to go lower...These lows represent the transitional area between trends - from sets of lower highs & lower lows to sets of HH's & HL's...These become the dragon's front and rear "feet" and they indicate that recent downward P/A is in the process of changing...the feet are either developing a new support level or are re-discovering an earlier support level...(When using very short term charts, the price levels of the front and rear feet should be exact, or within a tick or two of each other)
The Hump
The dragon's back or "hump" prints between the two sets of "legs" and will usually become the first higher high of the new upward trend (provided of course that the legs prove to be support).
The Head
A price consolidation area, or a "head" often develops shortly after the two support legs have formed...
Sans the head, the pattern is 'just' a 2B or double bottom...But with or without the head, it's a pattern that traders should be aware of. 2Bs and Dragons happen frequently on very short or long term time frames and they lead to powerful drives that can be taken advantage of when spotted early.
2B Dragon on a Daily equity chart (AA or Alcoa Aluminum) (12/03/2010)

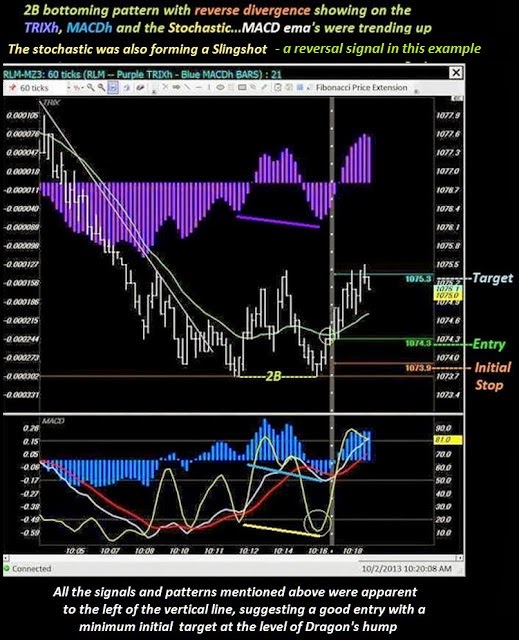
2B Dragon on an Intraday futures chart (RLM or Russell 2000 e-mini)
 2B Dragon on an Intraday futures chart (YM or DJIA e-mini)
 2B Dragon before the majors opened.


11/05/2015 ... 2B Dragon reversal with MT SLING
Minute based patterns and signals are just as valid as those on tick charts. Shown below, price action 2B pattern combined with
the MT (MACD ema Trend) and the Stochastic Slingshot signals to increase the odds that a sustainable reversal had taken place.

Minute based patterns and signals are just as valid as those on tick charts. Shown below, price action 2B pattern combined with
the MT (MACD ema Trend) and the Stochastic Slingshot signals to increase the odds that a sustainable reversal had taken place.

2/06/2013 ... A 2xD 2B Dragon
Histogram divergence at the dragon's Rear-feet suggested a possible end to the down trend was imminent. The 2x divergence (TRIX histo and MACD) at the dragon's Front-feet said BUY...this had to do some work to break free of the level around the dragon's HUMP (over/under resistance) but the Reverse-Divergence there was encouraging.
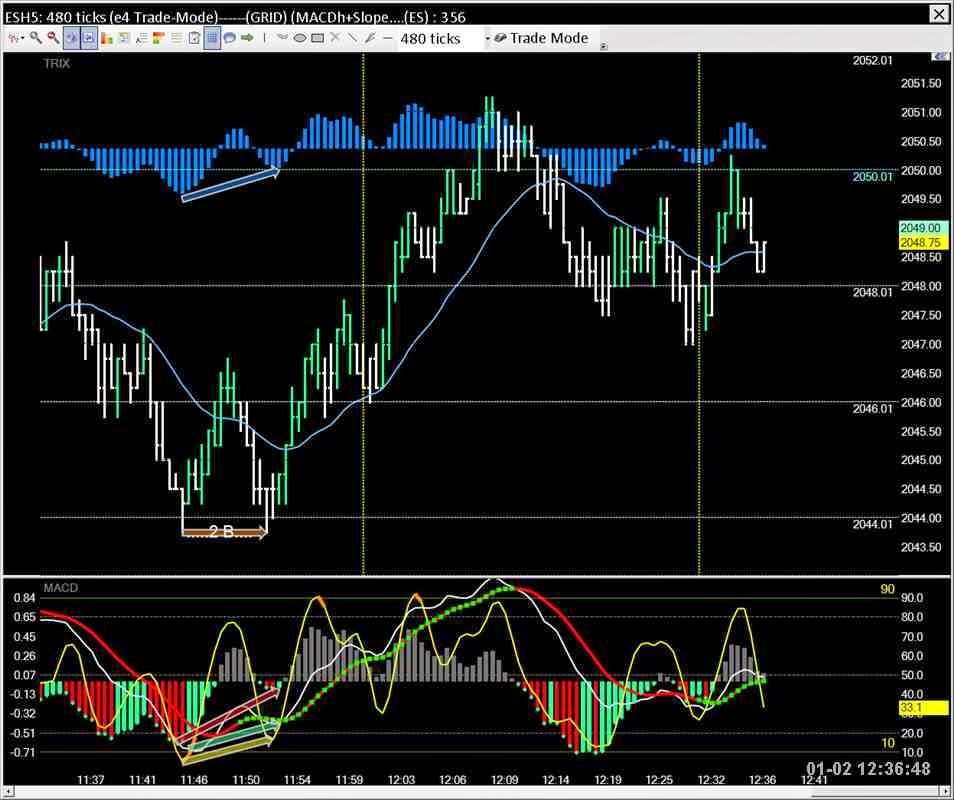
360 tick

The green and dark red coloring in the indicator pane is the MACD Trend indicator, showing cross-overs of the aqua Fast/Slow line and the red smoothing line. The solid, thin horizontal line marks the zero line for the MACD EMAs.
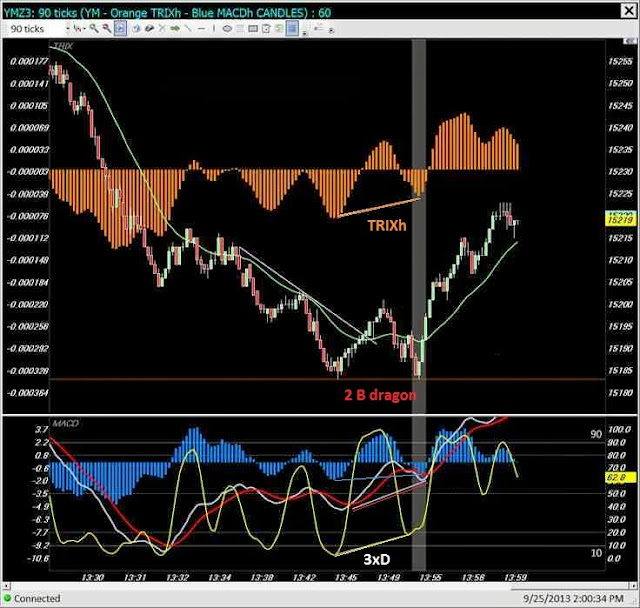
9/25/2013 ... A 3xD 2B Dragon
This one formed at and created a session low (orange horizontal line)...illustrating the power of this reversal pattern.
90 tick
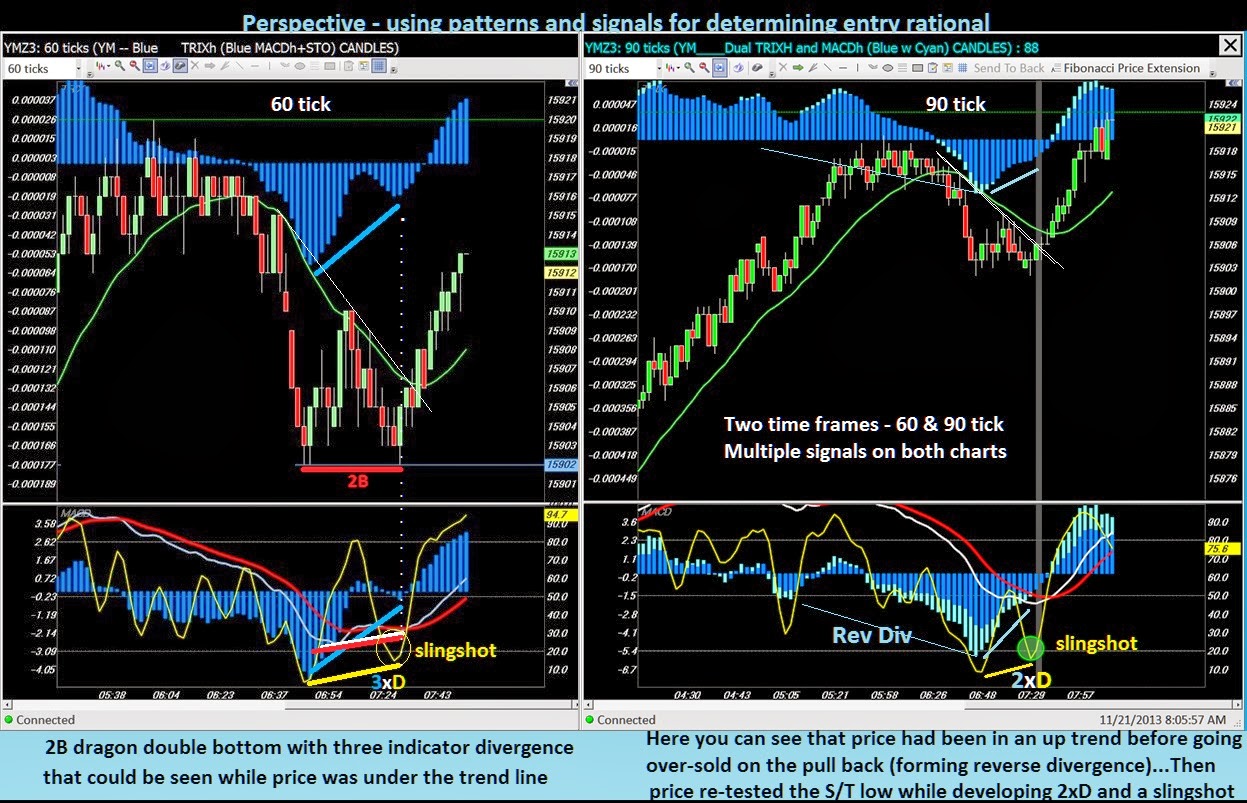
 11/21/2013 ... Another 3xD 2B Dragon
showing on two time frames
 01/02/2015...another 3xD 2B
They occur with surprising frequency
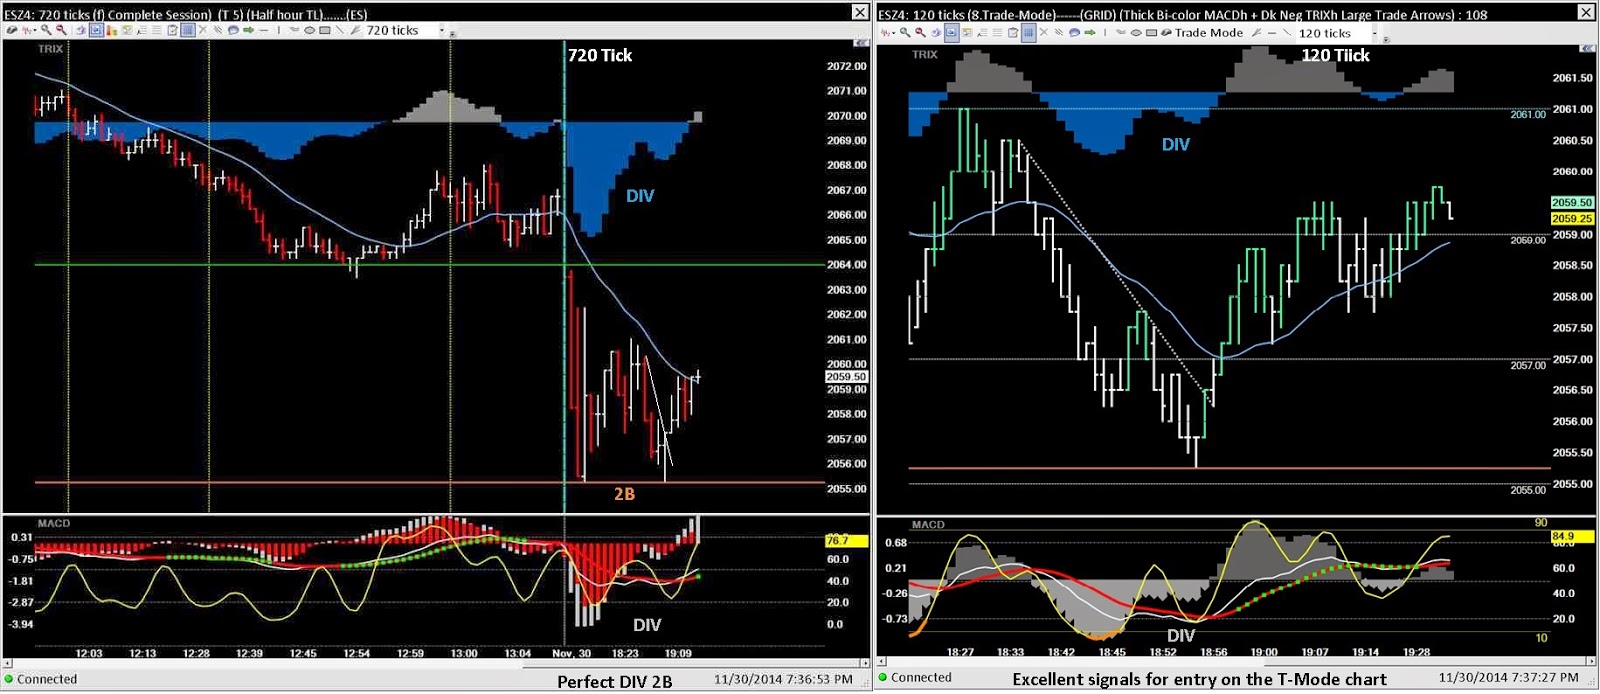
11/30/2014 ... Another 2B Dragon
showing on multiple time frames...the ES

2/07/2013 ... Another 2xD 2B Dragon
This one formed at and created a session low (orange horizontal line)...illustrating the power of this reversal pattern.
90 tick

showing on two time frames

They occur with surprising frequency

11/30/2014 ... Another 2B Dragon
showing on multiple time frames...the ES


2/07/2013 ... Another 2xD 2B Dragon
180 tick

4/20/2013 Fun with patterns:
WAG on price direction based solely on technical patterns...The picture below is showing a "long" term chart...
(2 hour per candle covering about 10 days (ten 24 hour sessions) of the YM e-mini futures)
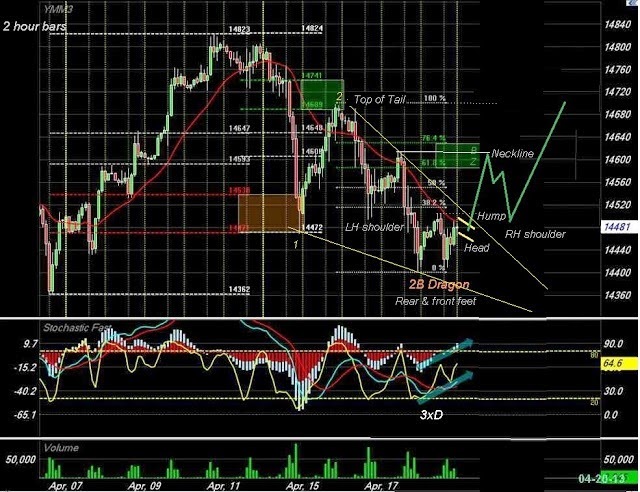
A busy chart above but its just for some fun...unless it plays out as predicted - then it will be a great call!
We shall see if price consolidates here, under the dragon's "Hump" level of 14500 to form its "head"...
Perhaps it'll do this in Sunday's and Monday's sessions.
Then, if it runs up to the BZ at 14600 or so and meets resistance, I'll consider 14600 to be the neckline
of an inverse H&S...from there I'll be looking for the RH shoulder to develop around ~14500 before any run up resumes...up to the best case "Top of the Tail" target of around 14700...
All bets are off if the red 30 WMA continues to turn price away and 14400 doesn't hold...much depends on whether the wedge has completed a wave 5 pattern or whether it has only completed wave 3 of 5...
Hows that for prediction postulations, LOL?
How often does price action get predicted with that amount of detail...and turn out to be right?
4/30/2013 Fun with patterns Results:
Well, I was a tad off with a lot of the above predictions but I did get the direction right...

3/12/2013 False Flags
Trades don't always work out...The picture below shows an entry I took using 3xD and a 2B dragon pattern as the trade rational. I entered using a Limit+TTO at the Hump, after it broke that level and retraced..
In retrospect, it wasn't a good trade to take in the first place - the low at the front feet was actually higher than the low at the rear feet, thus both entry reasons were wrong. There wasn't divergence and the Dragon never completely landed on the ground...
This is why I always use stops - to minimize the damage done by my sloppy chart reading, by uncooperative markets and by failed entry rational.

9/26/2013 False Flags
The sets below show another sloppy chart read...a miss-read signal.Shows how an initial false entry rational can 'snowball' into further false flags - resulting in a poor trade.
Set A ... both are 30 tick charts


3/22/2013
Using multiple time frames for perspective...plenty of patterns on each.

3/07/2013...Charts and women
Choosing which stocks to trade can be likened to how men (at least this man) choose their women friends...The initial look, the physical attraction is what first grabs a man's interest. This encourages him to to take the second step and talk to her, hoping that he will continue to admire what his first instinct found visibly interesting - potentially moving on toward developing a relationship. If a man can't get past the 1st and 2nd steps, he might still look at her admiringly from time to time but most likely no further action will be taken.
I use a similar method for picking which stocks to follow - I look first at it's chart. If I see a pattern I like, I'll then take the second step and glance at the fundamentals, looking for additional reasons to continue to explore my options. And even if the 2nd step fails to spark my interest further, I may still glance at its chart from time to time...
3/07/2013...Ideas
3/07/2013...Ideas
I get ideas from many different sources.Today an online friend, kensey, replied to a post I made on a new website he's in the process of creating. He is the creator of the very successful ClearStation website that melded Technical, Fundamental and Community analysis which he operated for over ten years before selling it to one of the major on-line trading companies.
Kensey's new website combines all of the great aspects that ClearStation provided plus he has added many terrific tools to enhance the user's experience; Market Scans and Trackers are two examples of new features he has included so far. I have always found his insights on market action to be of great value, along with his ability to narrow down the sectors/stocks that have above average potential...His new site promises to be even better than his previous one...
Kensey's new website combines all of the great aspects that ClearStation provided plus he has added many terrific tools to enhance the user's experience; Market Scans and Trackers are two examples of new features he has included so far. I have always found his insights on market action to be of great value, along with his ability to narrow down the sectors/stocks that have above average potential...His new site promises to be even better than his previous one...
Today he presented me with MITK which is exhibiting a 2B dragon pattern on the monthly chart...Below is a snapshot of his post and my reply. Take note of the increased volume that occurred on the run ups after both sets of dragon feet printed. Click the image to enlarge.


After all these years of scanning Daily/Weekly/Monthly charts I have become ever more convinced of the power of technical analysis. Not that technical chart patterns in and of themselves are the be-all-end-all of picking stocks that will move in the way that will guarantee you winning trades...or that stocks and indices will always move in the way a pattern suggests they should, T/A of patterns can certainly help to "cull" the wheat from the chaff...