US CPI Data: Core Inflation Trend Flat, Headline CPI Falls in March
•Download as PPTX, PDF•
0 likes•1,896 views

Headline CPI all-items inflation slowed in March, while measures of core inflation continued their flat trend.

Recommended
Recommended
More Related Content
What's hot
What's hot (20)
Viewers also liked
Viewers also liked (19)
Similar to US CPI Data: Core Inflation Trend Flat, Headline CPI Falls in March
Similar to US CPI Data: Core Inflation Trend Flat, Headline CPI Falls in March (17)
More from Ed Dolan
More from Ed Dolan (20)
Recently uploaded
Recently uploaded (20)
US CPI Data: Core Inflation Trend Flat, Headline CPI Falls in March
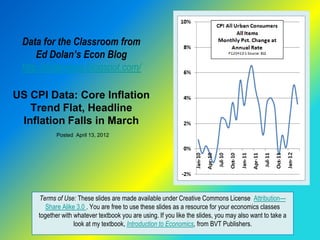
- 1. Data for the Classroom from Ed Dolan’s Econ Blog http://dolanecon.blogspot.com/ US CPI Data: Core Inflation Trend Flat, Headline Inflation Falls in March Posted April 13, 2012 Terms of Use: These slides are made available under Creative Commons License Attribution— Share Alike 3.0 . You are free to use these slides as a resource for your economics classes together with whatever textbook you are using. If you like the slides, you may also want to take a look at my textbook, Introduction to Economics, from BVT Publishers.
- 2. Headline CPI Inflation Slow Slightly in March The US all-items CPI showed a moderate increase in March, but slowing growth of gasoline prices allowed the headline inflation rate to drop back a bit from February The March headline inflation rate from the Bureau of Labor Statistics, stated as an annual rate, was 3.54%, down from 5.03% in February In addition to energy, prices of used vehicles, apparel, and medical commodities pushed the CPI higher Posted April 13, 2012 on Ed Dolan’s Econ Blog http://dolanecon.blogspot.com
- 3. Core Inflation Shows Little Trend in Recent Months Food and energy prices are highly volatile and usually account for much of the month-to-month variation in the CPI Their effect can be removed by taking food and energy out of the CPI. The result is called the core inflation rate. The recent uptick in inflation has largely been confined to the energy sector. As yet there is little spillover into general inflation as measured by the core CPI Posted April 13, 2012 on Ed Dolan’s Econ Blog http://dolanecon.blogspot.com
- 4. Trimmed Mean Inflation Is Closely Tracking Core Inflation Another way to remove volatility is the 16% trimmed mean CPI published by the Federal Reserve Bank of Cleveland. It removes the 8% of prices that increase most and the 8% that increase least in each month, whatever they are So far in 2012, the trimmed mean CPI has closely tracked the core CPI, but that has not always been the case Posted April 13, 2012 on Ed Dolan’s Econ Blog http://dolanecon.blogspot.com
- 5. Which Measure is Best? The CPI for all items gives the most accurate picture of current changes in the cost of living Economists at the Fed look closely at the core and trimmed mean CPIs to judge the effect of monetary policy on underlying inflationary trends The Fed considers inflation of about 2 percent to be consistent with prudent monetary policy All three measures of inflation were moved slightly above the Fed’s 2% target in January Posted April 13, 2012 on Ed Dolan’s Econ Blog http://dolanecon.blogspot.com
- 6. The Longer Term Trend To see longer term trends in inflation, it is useful to look at year- on-year changes, which compare each month’s price level with that of the same month in the year before All y-o-y measures of inflation rates slowed during the global recession, then rose again for most of 2011. The three measures shown here have been converging in recent months as inflation becomes less volatile Posted April 13, 2012 on Ed Dolan’s Econ Blog http://dolanecon.blogspot.com